D3.js Fun · 2018 · Data Visualization
Chopping Down the Family Tree Model of Ancestry Visualization


Abstract
Trunks is what happens when you chop down a family tree. It is a web application visualizes familial bonds in the form of a sunburst chart, inspired by rings on tree trunks. It serves as a screen-friendly alternative for the tree-model of ancestry visualization.

Chopping Down the Family Tree Model of Ancestry Visualization
UNDERSTAND
ANALYSE
DESIGN
VALIDATE
Doubting the Establishment
I first thought about the limitations of the traditional tree model in my summer Cultural Anthropology class. We were assigned to map a historical dynasty of our choosing using genogram notation. While sinking my teeth into the Habsburgs, I found myself pondering whether a family tree is the ideal way to display multi-generational swaths of data. Instead of diving deeper into descendants upon descendants, what if I wanted to display more lateral information on siblings, second aunts and cousins? Thus, this personal project was born. What is a better alternative to family trees that is more concerned with the breadth of relationships, rather than the depth?
Identifying Pain-Points of the Tree Model
I interviewed classmates in my Cultural Anthropology course about the same assignment assignment that inspired my inquiry into ancestral data visualization. I interviewed 5 people for 15 minutes each about their experience with the family tree project. Here are some of the things the students have said:
- I can only focus on one branch at a time and kind of ignore second cousins and anyone who is not a direct descendant.
- I have to move a lot of members to the side when I learn that the sibling got married and had children. It gets kind of convoluted and stretched in strange directions.

🔍 Poor Digital Scalability
The dimensions of family trees are unpredictable and based on the data being mapped. When the ancestor has many siblings, the graph is bloated horizontally. On the other hand, when the ancestor has many descendants, the chart is bloated vertically. Usually, full family trees are a bit of both. This variability is not accounted for when displaying graphs on digital screens, especially smaller viewport sizes. Even when viewed on a large screen, the window needs to scroll both vertically and horizontally, leading to unnecesasry gestures that diminish the user's experience. Therefore, the tree model is not suitable for a lot of screen usage, especially for a complete view of a large dynasty.
🔍 Perceptual Density
The horizontally and vertically variable design does not give a concise summary of data to the user at first glance. Hierarchy is not effectively communicated and requires more thinking of the user’s part. Additionally, traditional family trees are not usually color coded. There are few distinguishments between family tree branches. Effective data visualizations must be effortless to comprehend and the family tree model misses out on these criteria.
🔍 Narrow Scope
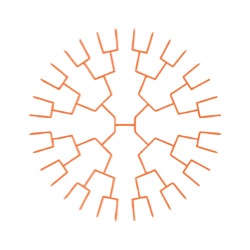
Family trees focus on one branch because it's hard to show all possible relatives without visual over-stimulation. Although this is the most common way to view family trees, these dimensional and sensory limitations result in unilaterality; you can only look at one branch at a time. But what if you wanted to see all branches in depth?
Developing the Trunk Model with Graph Theory
What type of graph is a family tree?
To understand the tree-model of ancestral visualization better, I decided to think of familial relationships mathematically. At the end of the day, a family tree is a graph, namely, a directed acyclic graph (DAC). A directed acyclic graph is a finite graph with no cycle, which means that there is a finite amount of vertices and edges, which can never loop. In the context of family trees, this means that no one can become their own ancestor. Therefore, I reframed the data visualization model of trees into a more general DAC graph pattern which will help me analyse its usage better.

Depth- vs. Breadth-First Search
To understand human cognition, it is often helpful to look at how computer algorithms work. After all, they are inspired by human cognition. In this case, we will look at two common graph search algorithms: depth-first search (DFS) and breadth-first search (BFS). These are two different ways people can construct and read familly trees. DFS follows the descendants of one child as far as it can go, from root to finish. On the other hand BFS traverses through all the children of a node, before moving on to the descendants.

Family trees are usually created with a depth-first search in mind. In the context of geneology, this means that the creator of a family tree takes one child and follows it deeply through generations of children, not thinking much about the auxilliary relatives, like siblings and cousins. In order to design a geneology visualization model that can display these auxilliary family members, one must take a breadth-first approach. The ideal system would account for all collateral ancestral relations. The challenge then lies in finding a visualization methodology that analyses and displays both the depth and the breadth of genealogical data.
Design Challenge
How might we architect a breadth-first model of ancenstral data visualization?
Making the Trunk Model Reality
JSON Structure
The first step in redefining genealogical data visualization is translating from traditional family tree models into something a computer can easily comprehend. I used the algorithm of a directed acyclic graph to determine vertices and edges by matching up parents and common children in a JSON file through name-value pairs. I then calculated generations by analyzing the structural depth of parental relations. Below is an illustration of how the pair structure works in a traditional tree model and a JSON file.

Tangential Inspiration
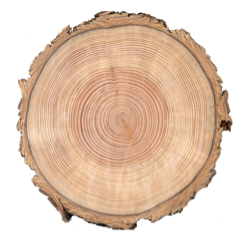
Instead of using the branch-system of ancestral relation, I drew inspiration from annual growth rings on tree trunks. The resulting visualization technique expanded multilaterally, rather than just to the left or right. As a result, I developed something I call the trunk model of genealogical data visualization. This radial model presents three distinct solutions to the issues posed by the traditional family tree.
Validating the First Iteration
The following is my first iteration for the web application Trunks, that uses the eponymous model in d3 to visualize some dynasties. I am using a color palette that is recommended by Colorbrewer 3.0, a colorblind-friendly and accessible palette generator. This iteration is the prototype one can view and work with live. While I am content with the model itself, the interface presented several issues that I am in the process of solving.
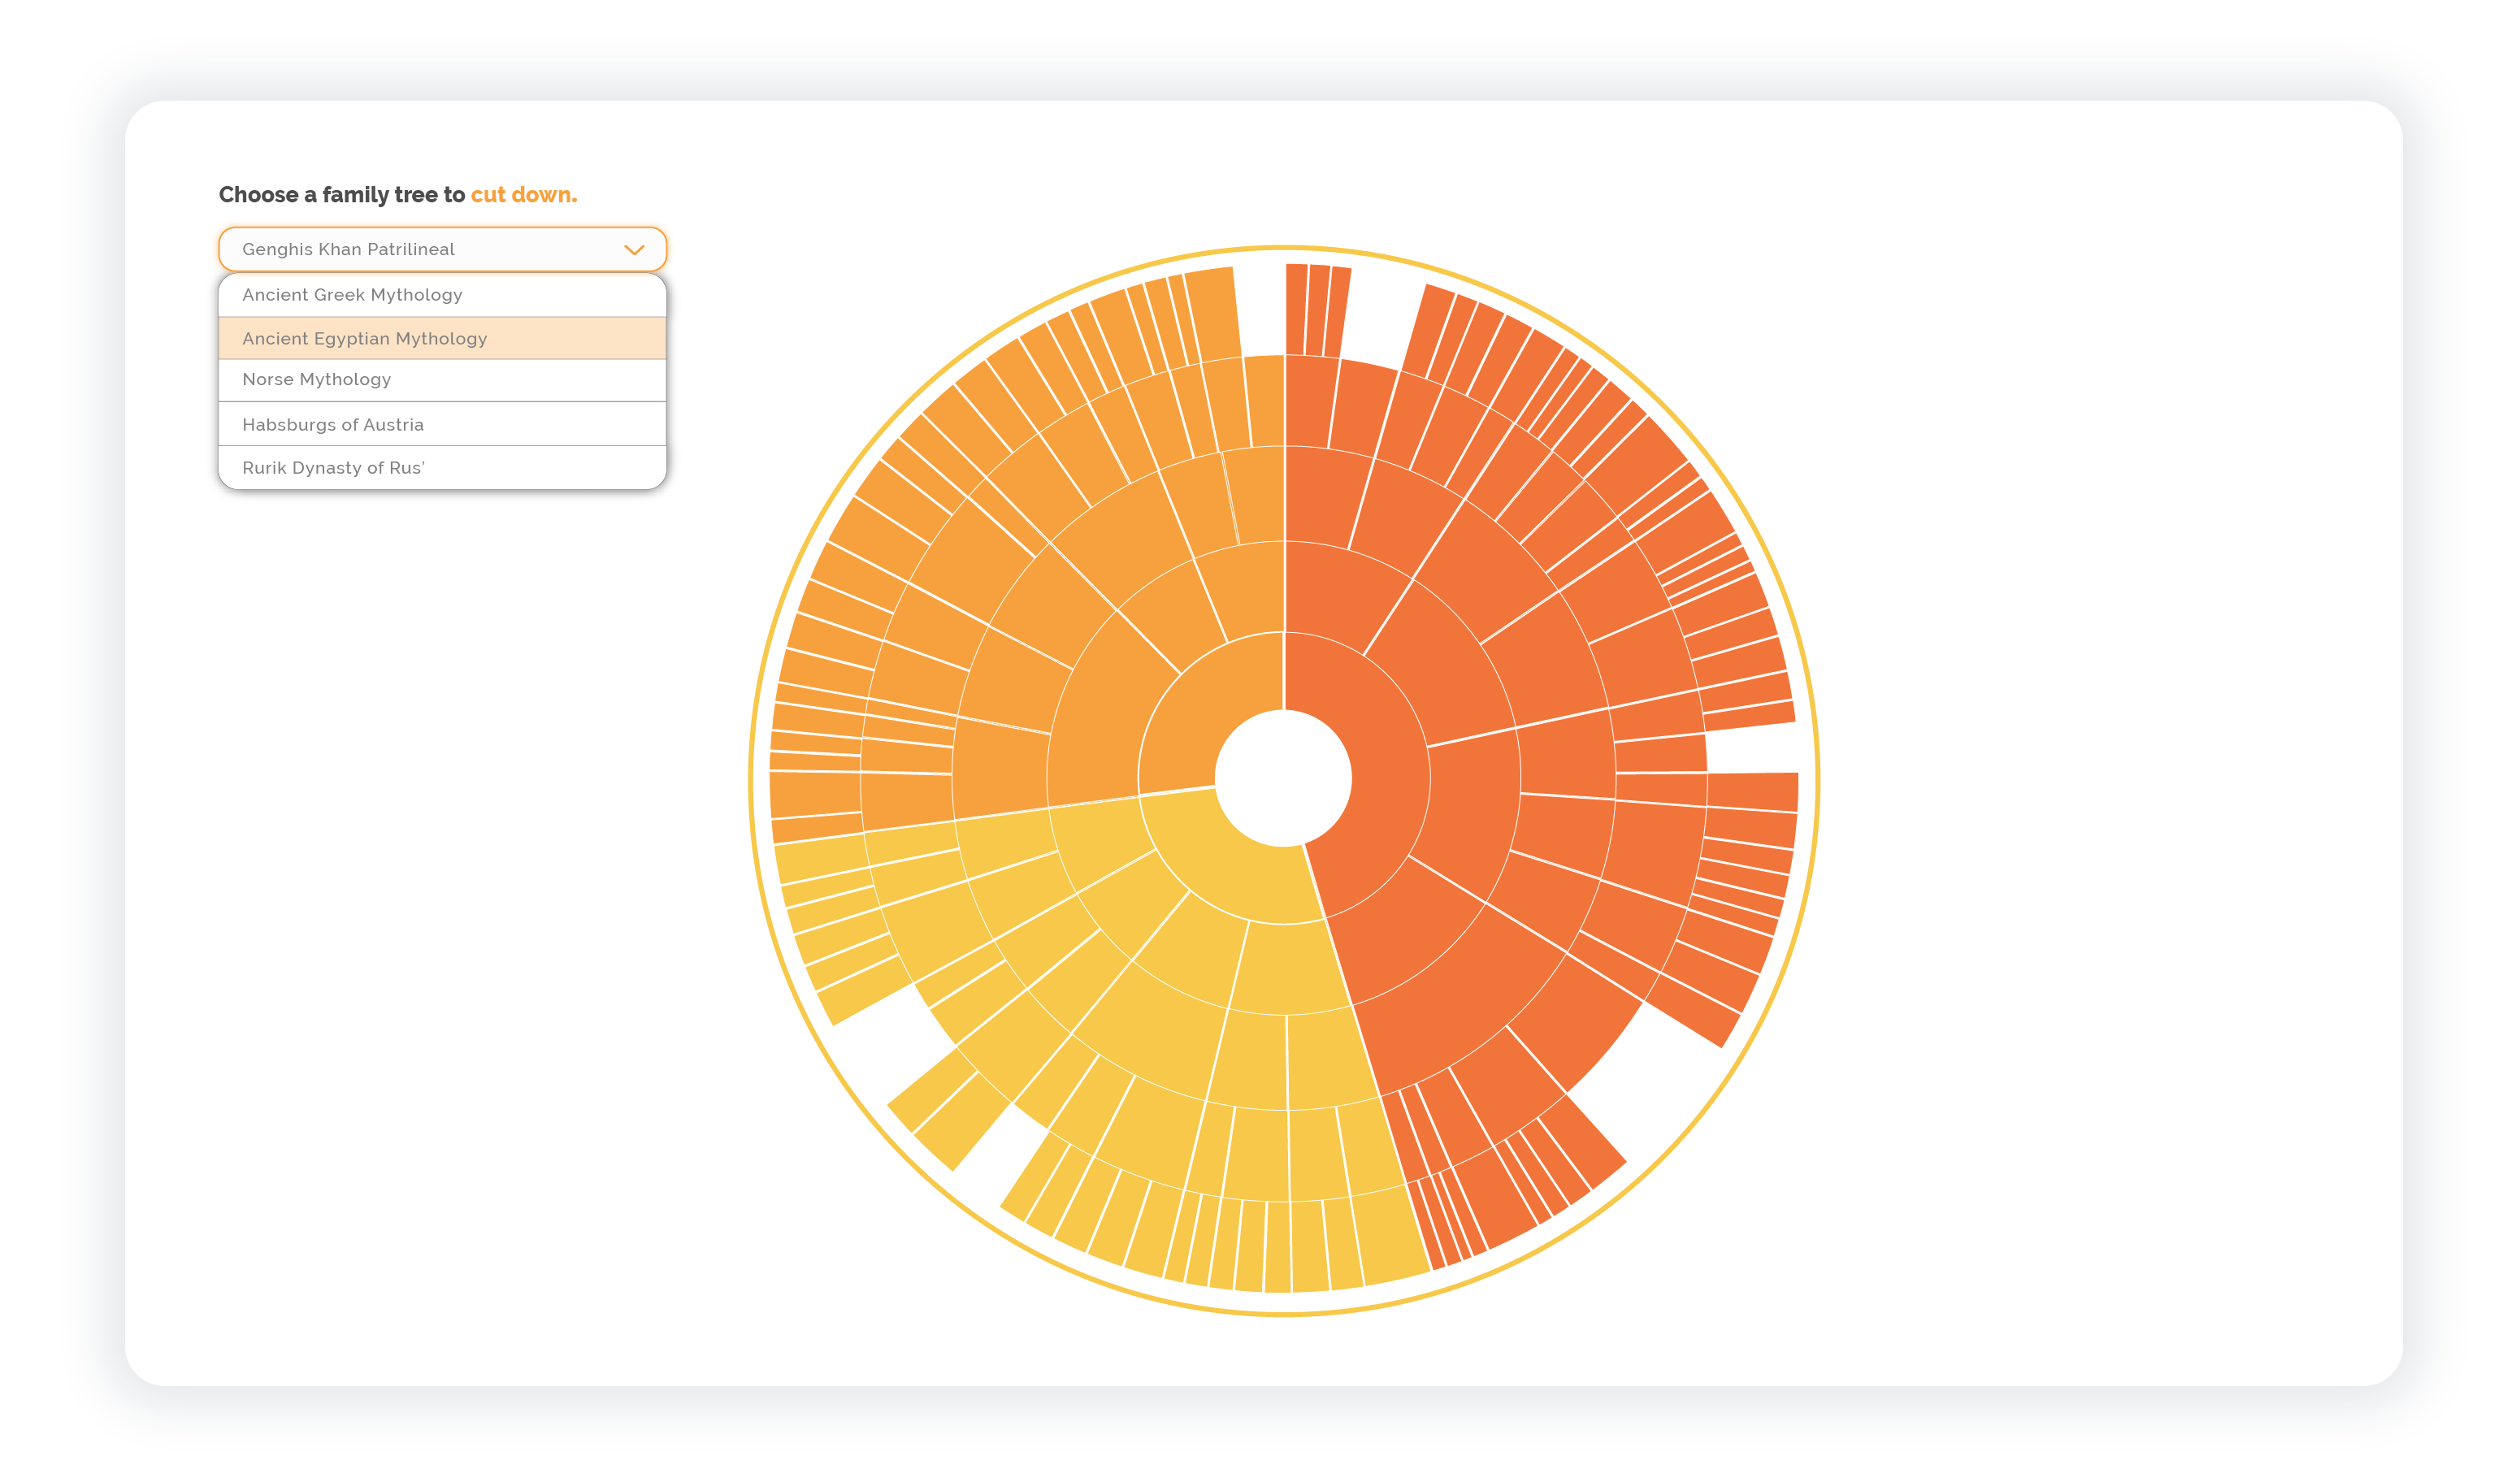
No Descriptive Labels
- Simply says that you're cutting down a tree.
- Doesn't really tell you what you are looking at.
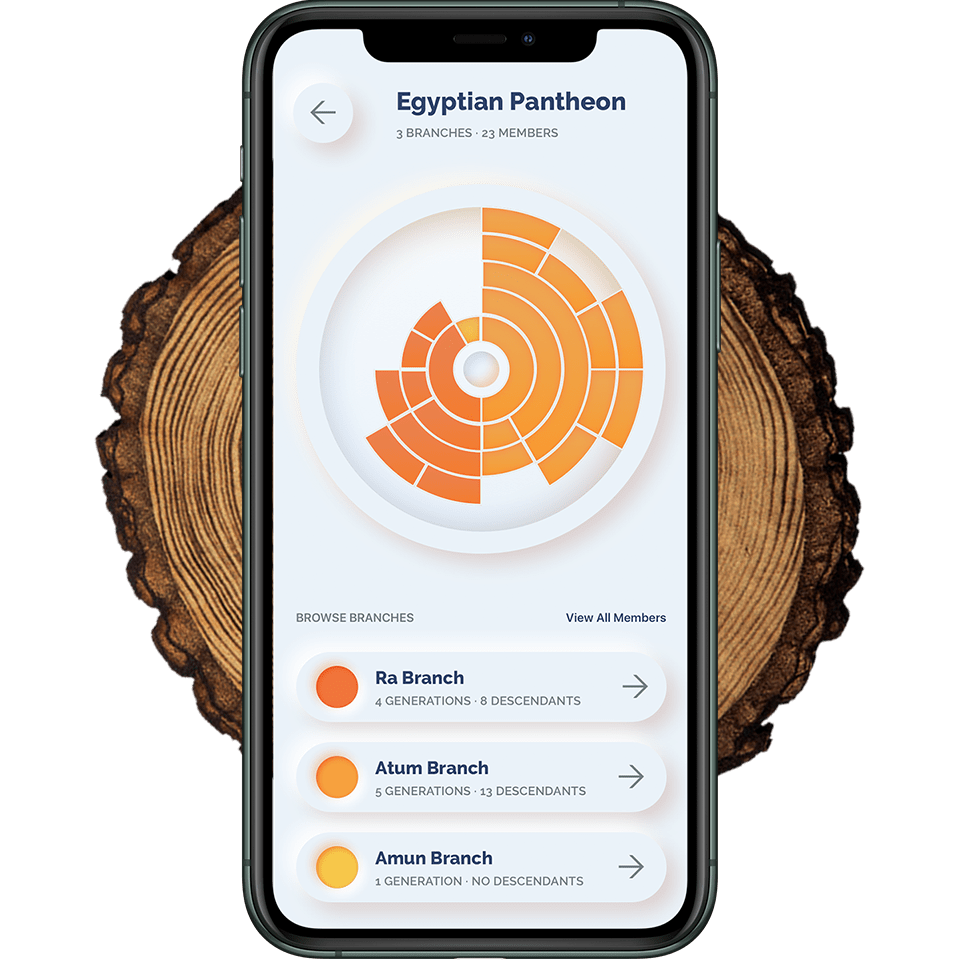
Developing the Second Iteration
While the first iteration is a sufficient demonstration of the concept, I wanted to go further and create a more illustrative way to explore various family trees with this model. The next and final interface is more visual and, by including previews of other family trees, prompts the viewer to explore them. In addition, the json structure allows me to pull more data and visualizations from it, and allow the user to view general statistics about the dynasty. Moreover, one can explore various branches of the family in depth. This concept is just that, a concept. It is not developed nor interactive. At least, not yet.
Testing the Model on Real Familial Lines
Forebears
To test out the concept of family trees I looked for a good geneological archive. The best one was found on Wikipedia. From there, I used the most complicated family tree I could find: Genghis Khan's lineage. Additionally, the family trees I used in the demonstrations were primarily pantheons of various world mythologies that I've found on Wikipedia. They were just complicated enough and allowed for some interesting variations in the trunks generated.
Future Development
Since Wikipedia was such a good resource for testing, a good next step for the project is to set up a way to feed family tree data from Wikipedia to Trunks. My search for an API was unsuccessful. Looks like Wikipedia uses a very strange, visual way to format their family trees which would be very difficult to translate into JSON. Nevertheless, the project as is remains a good proof-of-concept and can be expounded upon very easily. Try fiddling with it on GitHub!